Road Safety Manual
A manual for practitioners and decision makers
on implementing safe system infrastructure!

Road Safety Manual
A manual for practitioners and decision makers
on implementing safe system infrastructure!
Crash data is generally considered a key source of information when assessing and treating risk. However, in some countries, particularly LMICs, crash data may not be reliable or available at all. Additional surveys and data sources other than crash data may be the only reliable source of safety data available. As discussed in Identifying Data Requirements, this additional information (safety performance indicators) is also important in road safety management. These enable assessment of different policies, programmes and projects to identify their effect on road safety outcomes. This occurs through the collection and assessment of details on the interventions implemented and the intermediate outcomes.
A variety of other data sources are available, including information on road design and features, traffic data, survey data and exposure data.
Road inventory data are a major source of information that can assist in assessing safety. Because the impact of different road elements is well known, different elements or combinations of elements can provide vital insight into crash problems, including the key crash types contributing to fatal and serious injury outcomes (see The Safe System Approach). The following data are of particular use:
This presents a basic list of relevant road element types, but there are many other factors that may have an influence on safety outcomes. The International Road Assessment Programme (iRAP) collects around 70 attributes (see http://www.irap.org/about-irap-3/methodology for details of these attributes, and Proactive Identification for more information on iRAP, and Box for examples of the data collection undertaken in Mexico). In the United States, the Model Inventory of Roadway Elements (MIRE) provides a list of 202 elements that may be needed for making road safety decisions. Further information on MIRE can be found at https://safety.fhwa.dot.gov/rsdp/mire.aspx.
Road features need to be spatially located (ideally through a GIS-based system) to allow effective analysis and cross-linkage.
Road inventory data relevant to road safety may already exist (e.g. through road asset database systems) or it might need to be collected. A situational assessment should be performed to see whether this data exists (see Establishing and Maintaining Crash Data Systems). Road inventory data has traditionally been used for road safety audit or inspection (see Assessing Potential Risks and Identifying Issues), but in more recent times, methods have been developed to quantify the likely safety outcomes based on these elements. The case study below shows Mexico's efforts to collect data on 46,000 km of its Federal Highways.
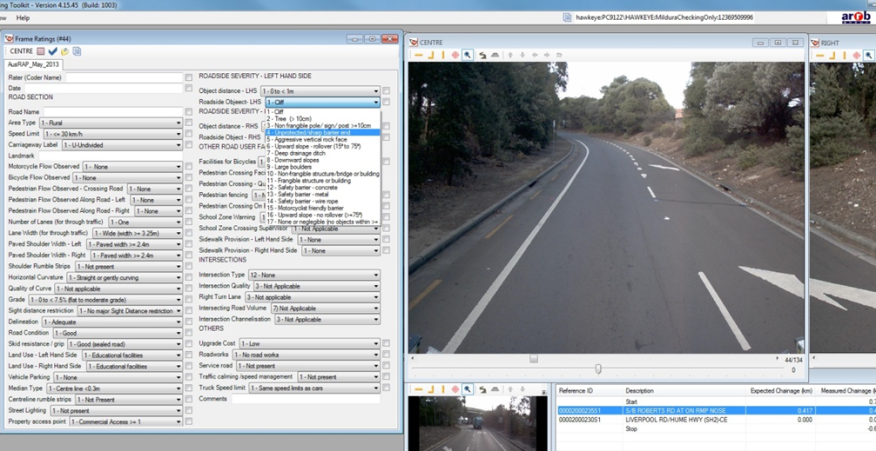
The collection of this data can be based on ad hoc approaches (e.g. through periodic inspection, public complaints, etc.), but should ideally be through a comprehensive programme conducted on a regular basis. The most common approach involves the collection of data through video images, and subsequent rating or coding of this data by trained experts. This information is then fed into a database or asset register (see Box 5.3).
For more extensive data gathering, computer-aided collection can be undertaken using a tablet or laptop, or information can be collected via video and coded safely back in the office. With a tablet, information is added to a database while travelling along the road of interest. Touch screen technology is typically used to select relevant road variables. Different symbols may be displayed on screen to facilitate quick data entry. As mentioned earlier, it is often difficult to enter all relevant variables when travelling at high speeds or in busy environments, and so video is often recorded to assist in later data entry and checking.
Another option involves the desktop assessment of video data. One or more video cameras can be used to collect data along the network of interest. A single camera can be used to gather information in a forward direction. Alternatively, more cameras can be used to allow better collection of road and roadside information. This video imagery is then used to code the variables of interest. The video images can be calibrated to allow measurement for more accurate collection of information (such as road width or distance to roadside hazards) and to ensure accurate spatial location of assets.
Video images are assessed, and can be paused to study more complex environments. Information from the images is added to a database for later analysis. This data entry may be through a dropdown menu system or manual population of a database. Data is typically collected for a discrete length of road (e.g. a 10 m section).

New technologies are being developed that will assist in more automated collection of road and roadside data. As an example, it is possible to collect information on features such as road width, horizontal and vertical alignment, and road surface condition using Light detection and ranging (LiDAR) and other vehicle sensors.
Traffic data is important to collect and analyse, particularly traffic volumes (or Average Annual Daily Traffic, AADT). This data can be used to generate crash rates, which provide a good indication of safety performance, including the safety performance of specific routes, road types or even infrastructure elements. Other types of traffic data include the traffic mix (e.g. percentage of different vehicle type; motorcyclists, bicyclists and pedestrians) and vehicle speeds (mean and 85th percentile speeds, compliance with speed limits). Traffic data can be collected using manual traffic counts or through automated means (e.g. pneumatic tubes or permanent data collection devices installed in the pavement).
Aside from traffic data, other sources of exposure data include population data (total number of people; number by each age group) for an area or country. This data is typically available from national census data. Vehicle registration data is also often collected and used.
Attitude surveys collect information on the views of drivers, other road users and residents. This information is considered an important source of feedback for assessing the effectiveness of a new programme or treatment, and can provide insight into driver behaviour (for example, low compliance levels with the posted speed limit).
Information on the number of police checks (e.g. for speed, alcohol, restraint use), number of violations (e.g. number of vehicles speeding; motorcycle riders without helmets), and number of drivers punished (e.g. fined, penalties provided or imprisoned) are all useful measures. These will help assess the impact of new policies or actions on safety outcomes.
In addition to the data sources mentioned above, other useful information can be gathered from the following sources, where available:
Other types of compliance data are discussed in the following section.

Often traffic data and driver behaviour data are not readily available. There is no set list of additional data that must be collected, and given the cost of any type of data collection, careful thought needs to be given to this task, regardless of whether this is conducted at national level or for specific locations. Additional data should be collected when there is a need for it, and collection of this data should be cost-effective.
The following section provides a brief description of some of the more common data surveys performed, as well as different methods that can be used. References to useful material is also provided.
A spot speed survey involves the collection of a sample of speeds at a specific road location, or at a number of locations. This can then be used to determine the speed distribution of vehicles, which is useful for the following reasons:
Vehicle speeds can be measured using manual methods (radar or laser guns, stop watch), or using automatic methods (loops or tubes). Automatic methods are better for studies that require a larger sample. Loops and tubes can also record more than just average speeds, such as traffic volumes, vehicle turning movements and traffic mix. These components are essential to understanding the safety issues that exist at a location. The GRSP Speed Manual (GRSP, 2008) and the UK government (DTR, 2001) provide in-depth guides to speed and volume measurements and how to manage speed-related safety issues. See case study on speed data collection in India.
GRSP has developed two separate manuals, one dedicated to seatbelts and child restraints (GRSP, 2009) and the other dedicated to helmets (GRSP, 2006). Each of the manuals provides information on how to assess the extent of non-seatbelt and non-helmet use in a project region, as well as how to design, implement and evaluate a programme to target these issues. With regard to measuring seatbelt and helmet usage, the guides list possible sources of this information, as well as how to collect the data through conducting community surveys and observational studies.
Much like measuring helmet and seatbelt usage, GRSP has developed a road safety manual for drink-driving (GRSP, 2007). This provides information on how to assess the situation and choose priority actions, as well as how to design, implement and evaluate a drinking and driving programme.
The guide suggests collecting data from relevant authorities, such as the police, road authorities and health sectors, to understand the size of the problem. Data on the level of compliance with existing laws can be collected through a combination of crash data (i.e. crashes involving drivers and riders with Blood Alcohol Content (BAC) levels exceeding the legal limit), the number of alcohol offences detected by police, the percentage of drivers stopped with a BAC over the legal limit, and by performing driver surveys (GRSP, 2007).
There are a variety of other intermediate outcomes that could be measured, depending on the interventions implemented.
As for crash data, it is important that survey data be recorded in a way that can be analysed easily. It is also beneficial for the system to be developed so that data can be linked with other data sources. This is particularly important for surveys that cover a broad geographic area (such as traffic volume, asset or population data). Such systems may already exist for this data. A common method is to link data by location using a Geographic Information System (GIS). These systems can typically store information that is linked geographically for future analysis. Different types of data can be added to such systems as a ‘layer’, allowing more powerful assessment of risk (see Analysis of Data and Using Data to Improve Safety).